Here’s something we’ve noticed working with companies over the years: everyone wants to be data-driven, but the reality is messier than the goal.
You’ve got your dashboards, your CRM analytics, your BI tools. They’re all sitting there, ready to help you make decisions.
But there’s still that frustrating gap between transforming data and turning it into action.
We’ve been working on something at Stellaxius that closes that gap.
Instead of making people hunt through dashboards or wait for the BI team to build new visualisations, what if you could just ask a question in many languages and get an answer? Better yet, what if you could act right there, without bouncing between different tools?
That’s what we’re building with Tableau Next and Salesforce’s Agentforce. In this article, we will show you how it works.
You can also check out our demo on Agentic Analytics for a full experience:
1. Getting Your Data Ready
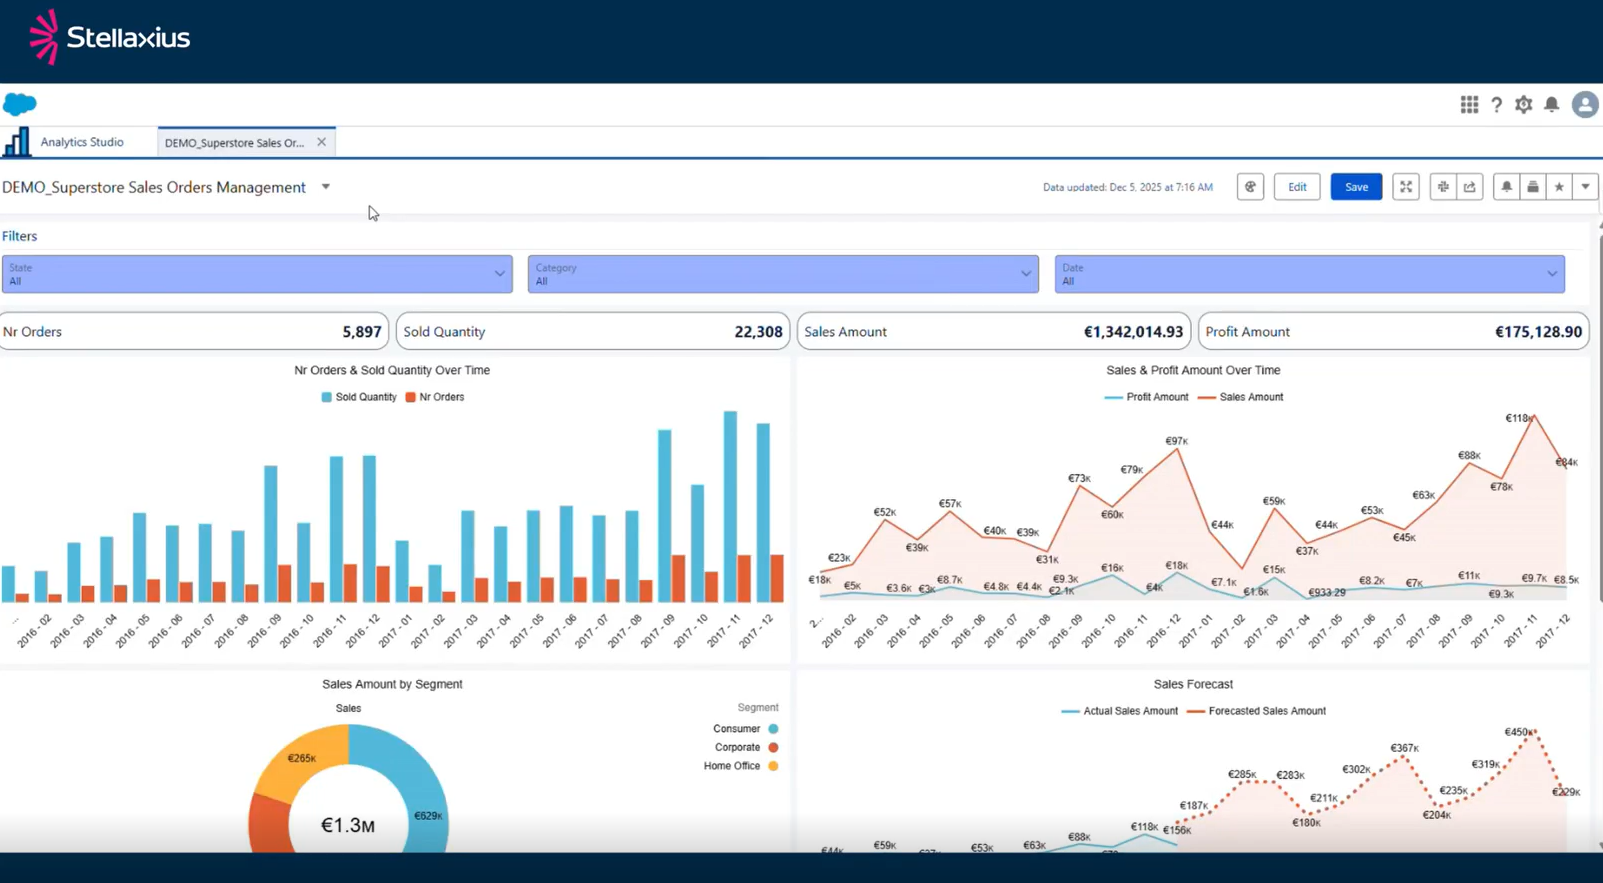
We started with a typical CRM Analytics dashboard. In this case, tracking sales and orders for a fictional company called Superstore.
It’s built on data prepared using CRM Analytics recipes, which is one of the ways Salesforce supports data transformation and preparation.
But here’s where things get interesting.
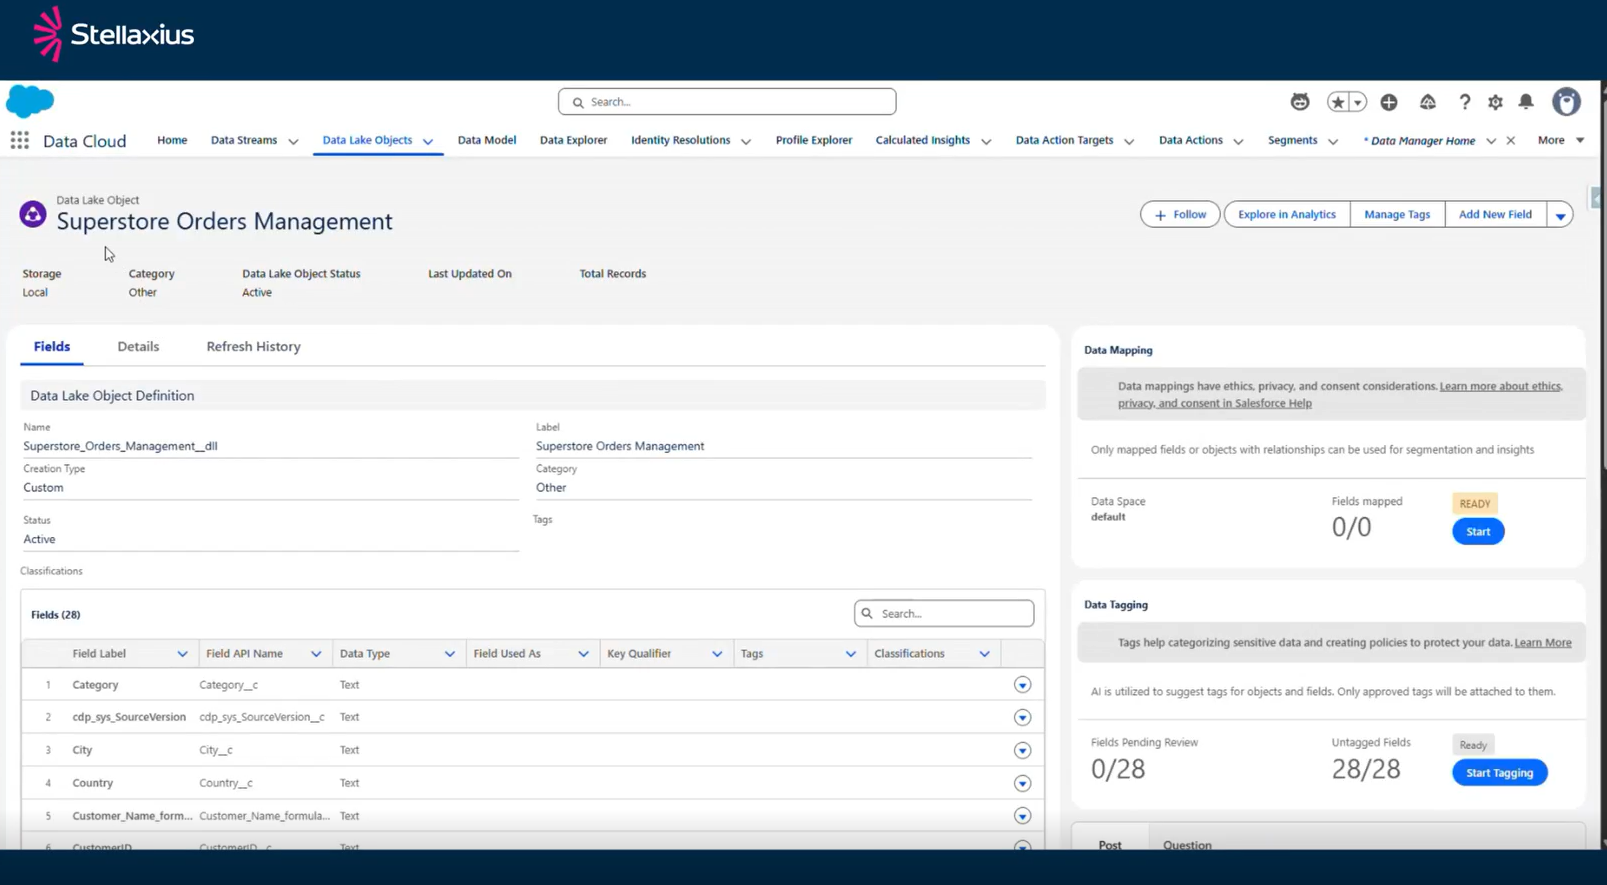
To make this data available with Tableau Next and Agentforce, we needed to convert it into something called a Data Lake Object in Data 360. Think of this as creating a bridge between your CRM Analytics built dataset and the next-generation analytics tools.
The process is straightforward: you create a recipe that takes your analytics outputs and converts them into Data Lake Objects (DLOs) in Data 360.
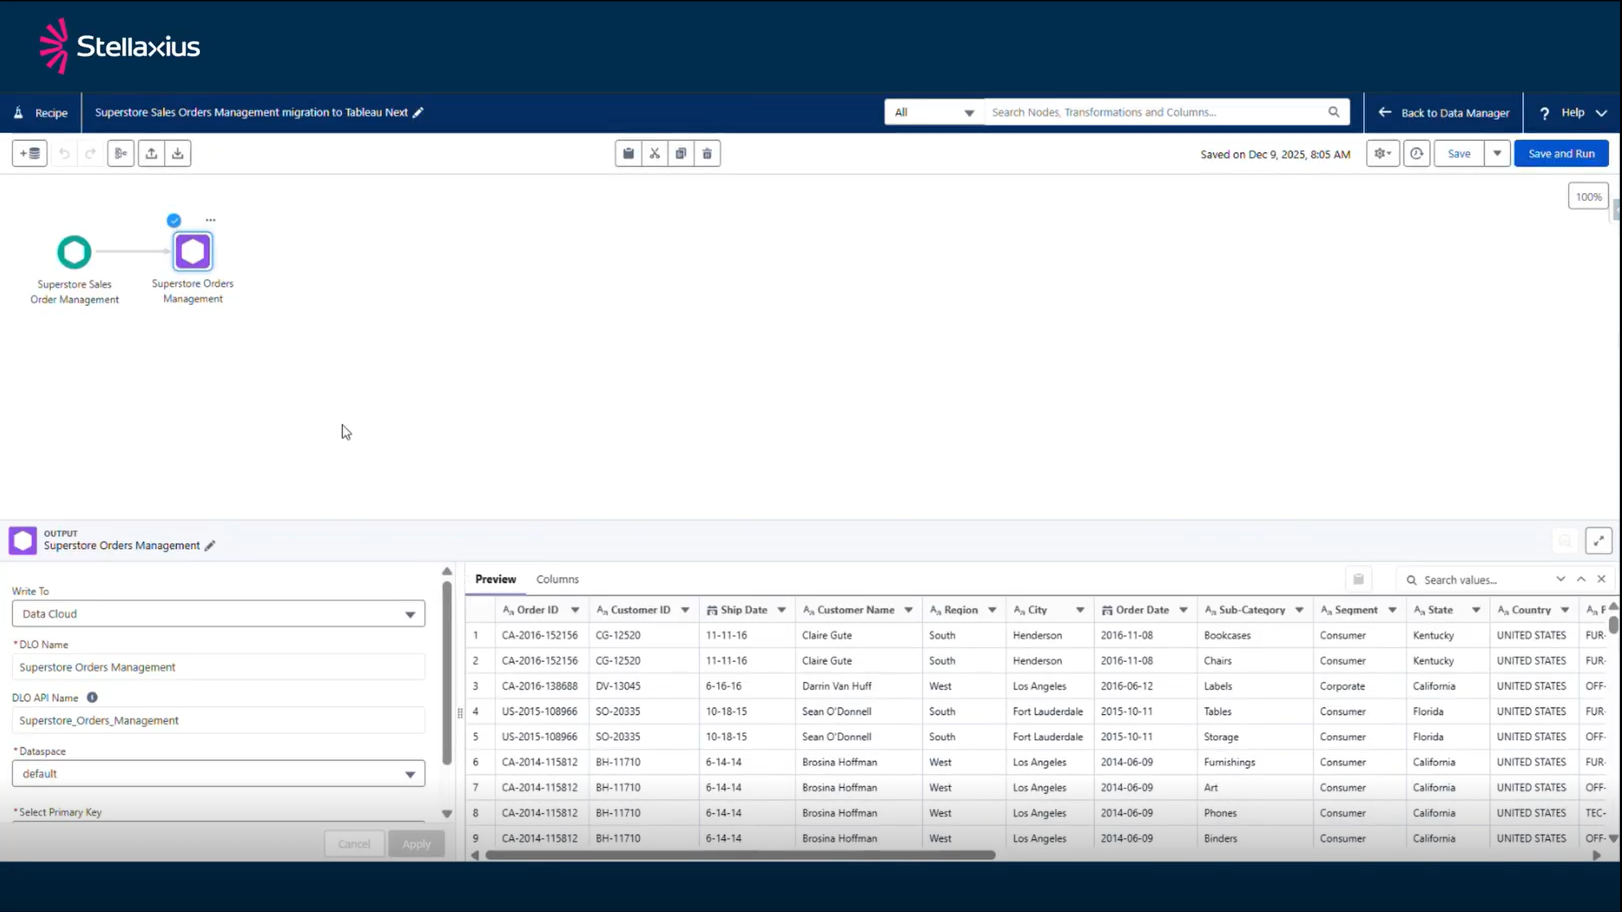
Once that runs, the DLO is automatically created, and your data is ready to be used in Tableau Next.
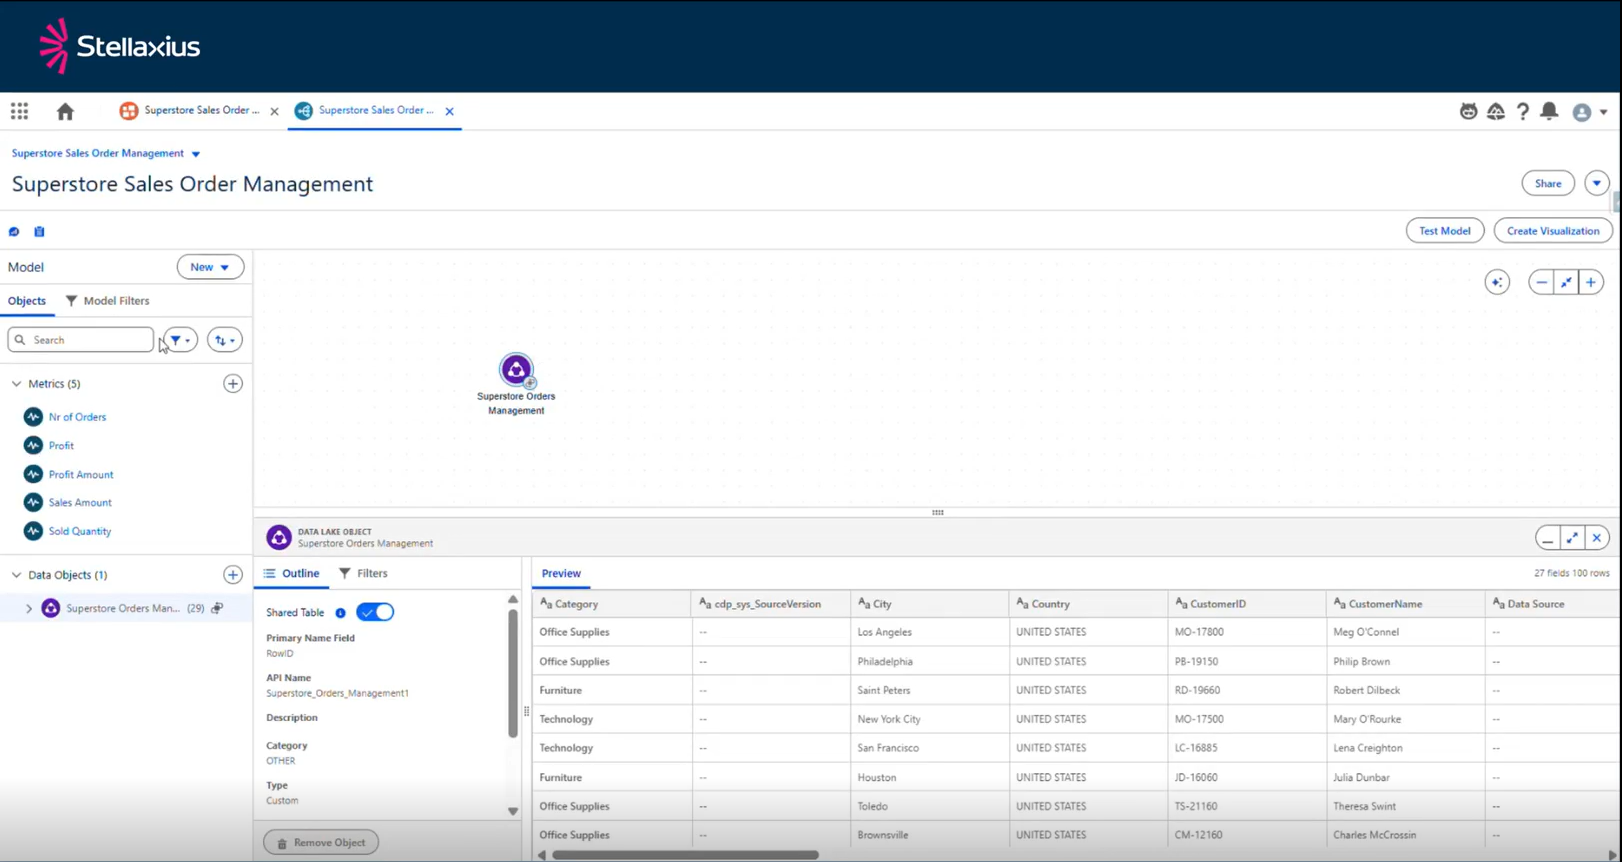
2. Semantic Models
The Semantic Model is built on top of the Data Lake Objects coming from Data 360. What makes this powerful is that we’re not just seeing raw tables — we’re working with a business-ready and governed layer. The Semantic Model becomes the single source of truth for analytics and AI. It guarantees that whether someone is building a dashboard, asking a natural-language question, they’re all using the same data.
3. Talking to Your Data
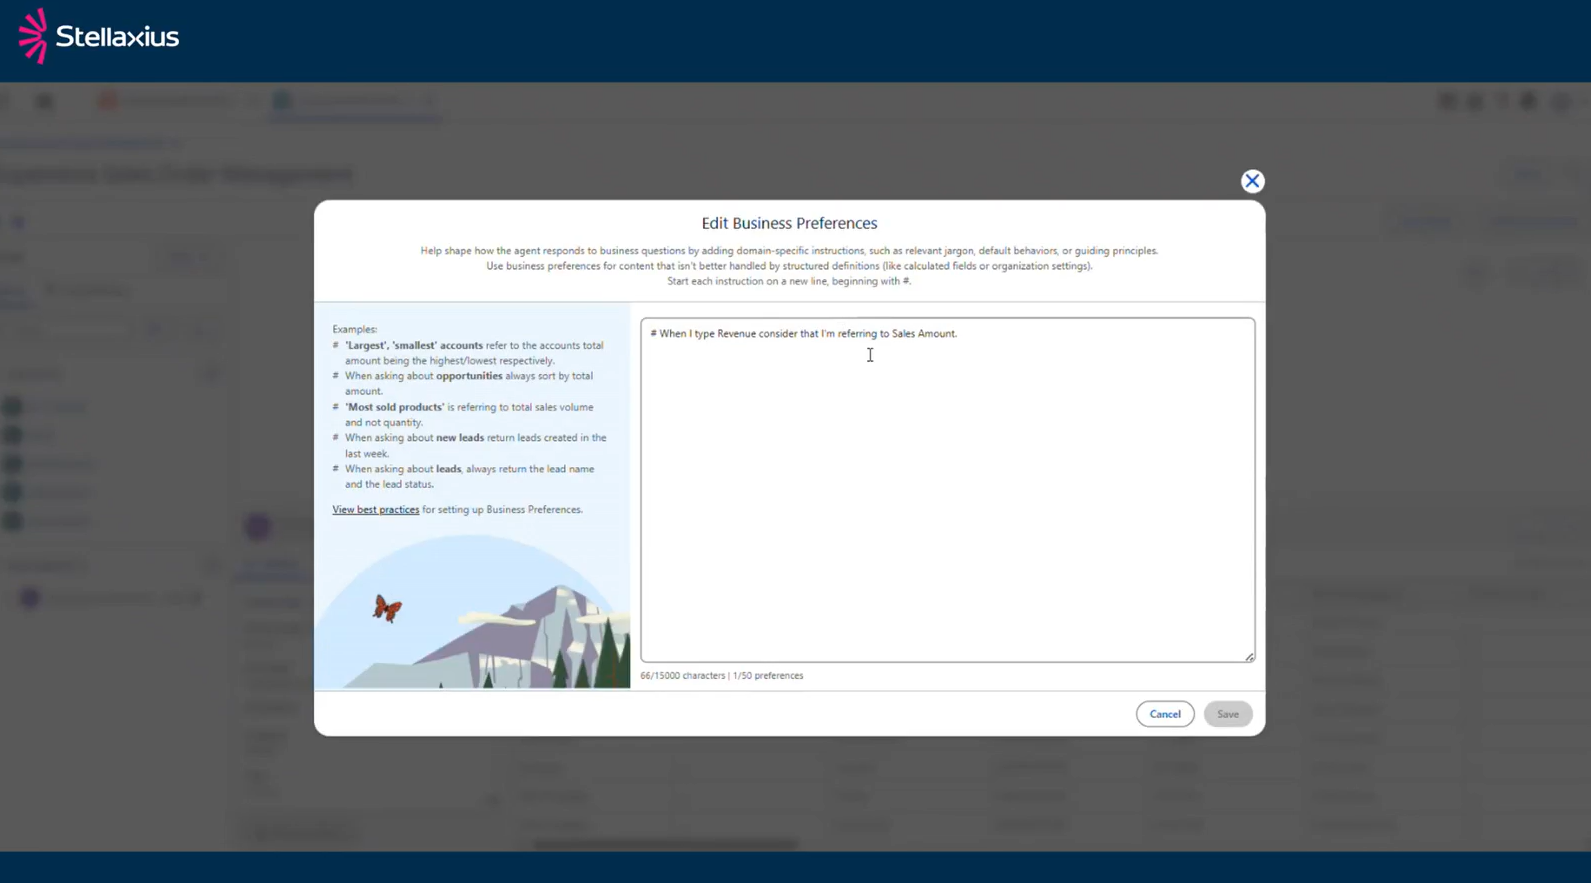
After setting up the semantic model, there are other things you can define such as the semantic layer. In there, you can assign business preferences to ensure that the agent understands the business context. For example, when someone in sales talks about revenue, the agent knows they mean the sales amount field.
Once your semantic model is set up, you can create a Tableau Next dashboard. At first, the experience looks familiar: charts, metrics, and visualisations similar to what you may already know from CRM Analytics. However, the real thrill starts in the corner of the screen, you’ll notice the Agentforce icon.
Click that and you can start asking questions using natural language.
“What was the total revenue in 2016?”
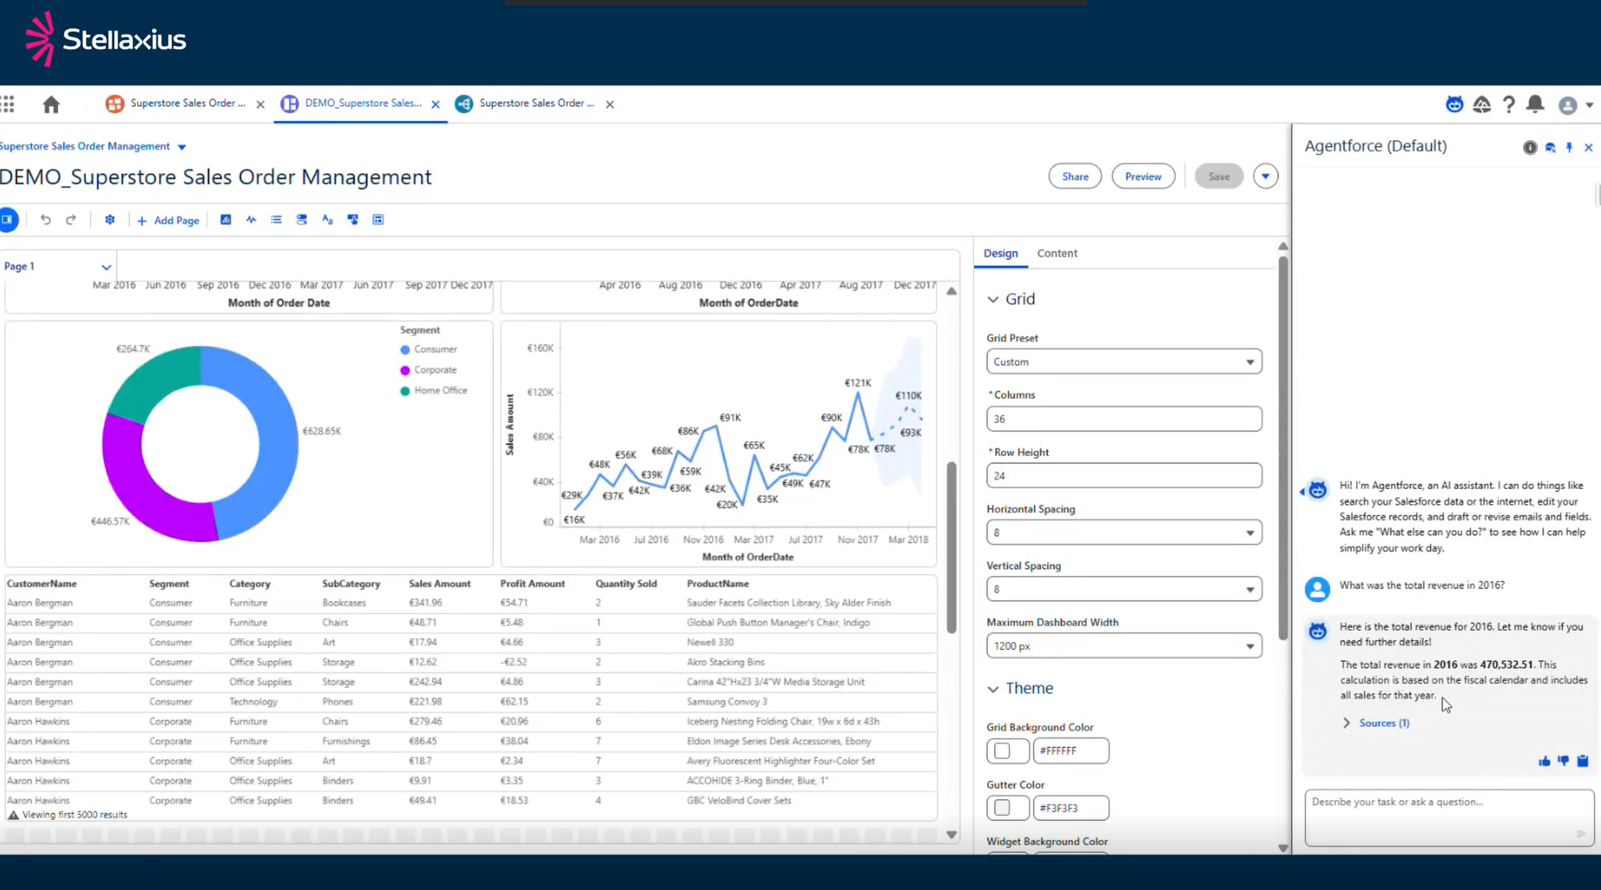
The agent thinks for a second, pulls from your semantic model, and gives you an answer. Not just a number floating in space, you get the full context: where it came from, what it means, and its sources, all powered by the semantic model that the LLM is using in the background.
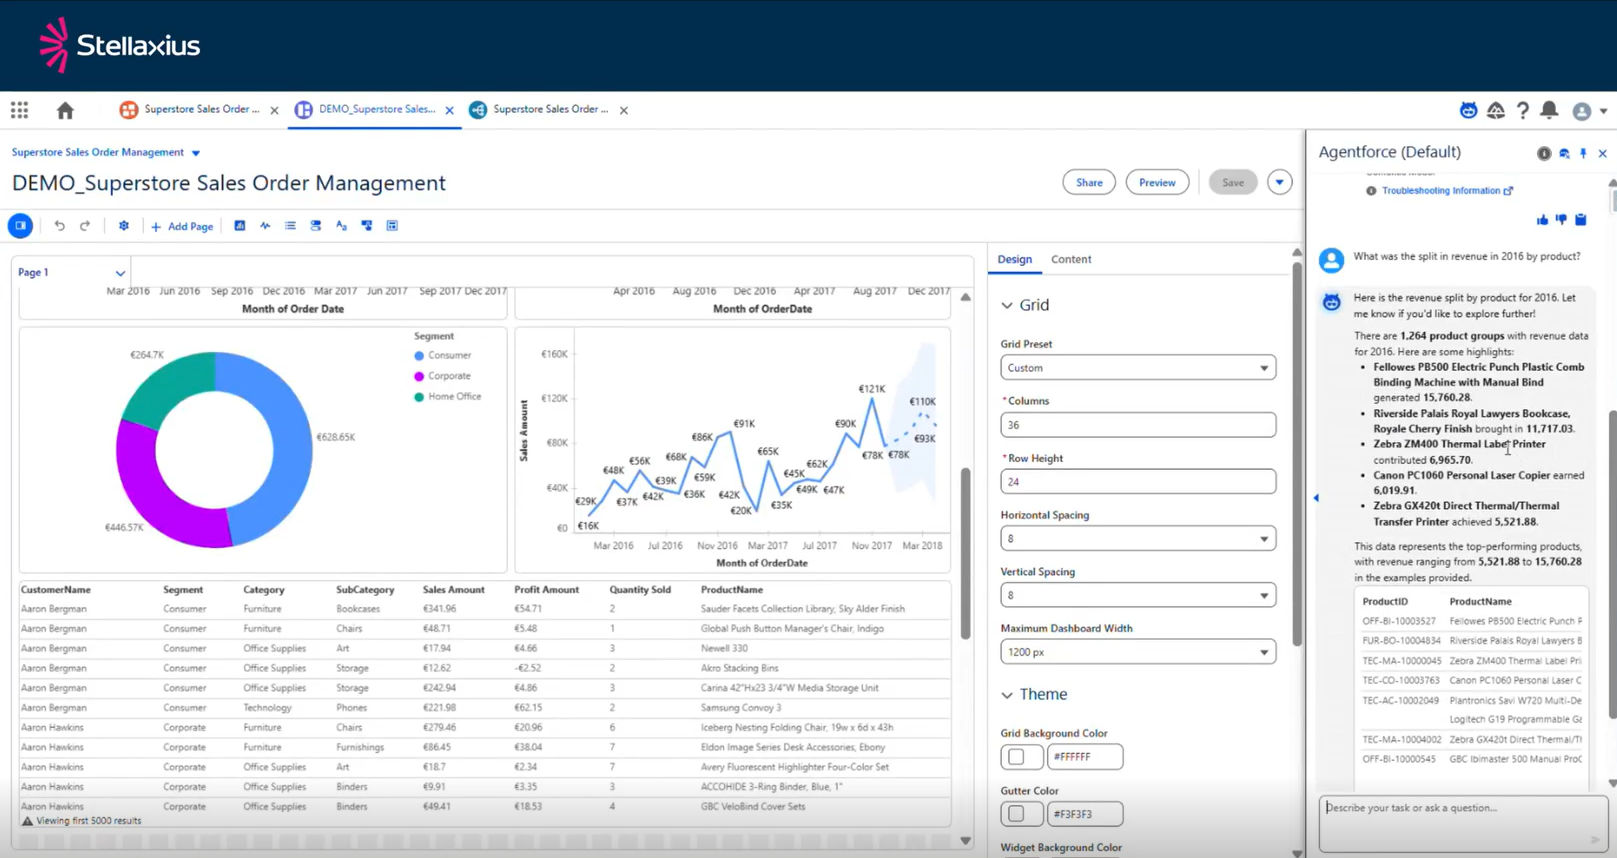
Want to dig deeper? Ask something like:
“What was the split in revenue in 2016 by product?”
The agent doesn’t just give you a number this time. It creates a table right there in the chat, breaking down the revenue by each product category. And again, it shows you its source: that semantic model you built.
The dashboard might show total revenue, but it doesn’t have that product breakdown. Before, you’d have to either build it yourself or ask someone else to. Now you just ask.
4. Two Paths to the Same Place
What’s practical about this approach is that it meets you where you are.
If you’ve already got CRM Analytics dashboards that people rely on, you can embed them in your Salesforce pages and simply enhance them with Tableau Next Analytics Agent, since they are governed by the same data. In this case, you’re taking advantage of Agentforce analytics capabilities.
Or maybe you’re starting fresh. In that case, you can build the semantic model from scratch in Tableau Next and ground up as your visualisation layer. Either way, you’re working from the same govern data and the same business logic.
5. What Does This Mean for Your Team?
Think about the questions people ask every day.
“Who was our top customer last year?”
“Which products aren’t selling?”
“Where are we seeing growth?”
These aren’t complex analytical queries. They’re business questions. But answering them usually means either building a report or remembering where you saw that information three weeks ago…
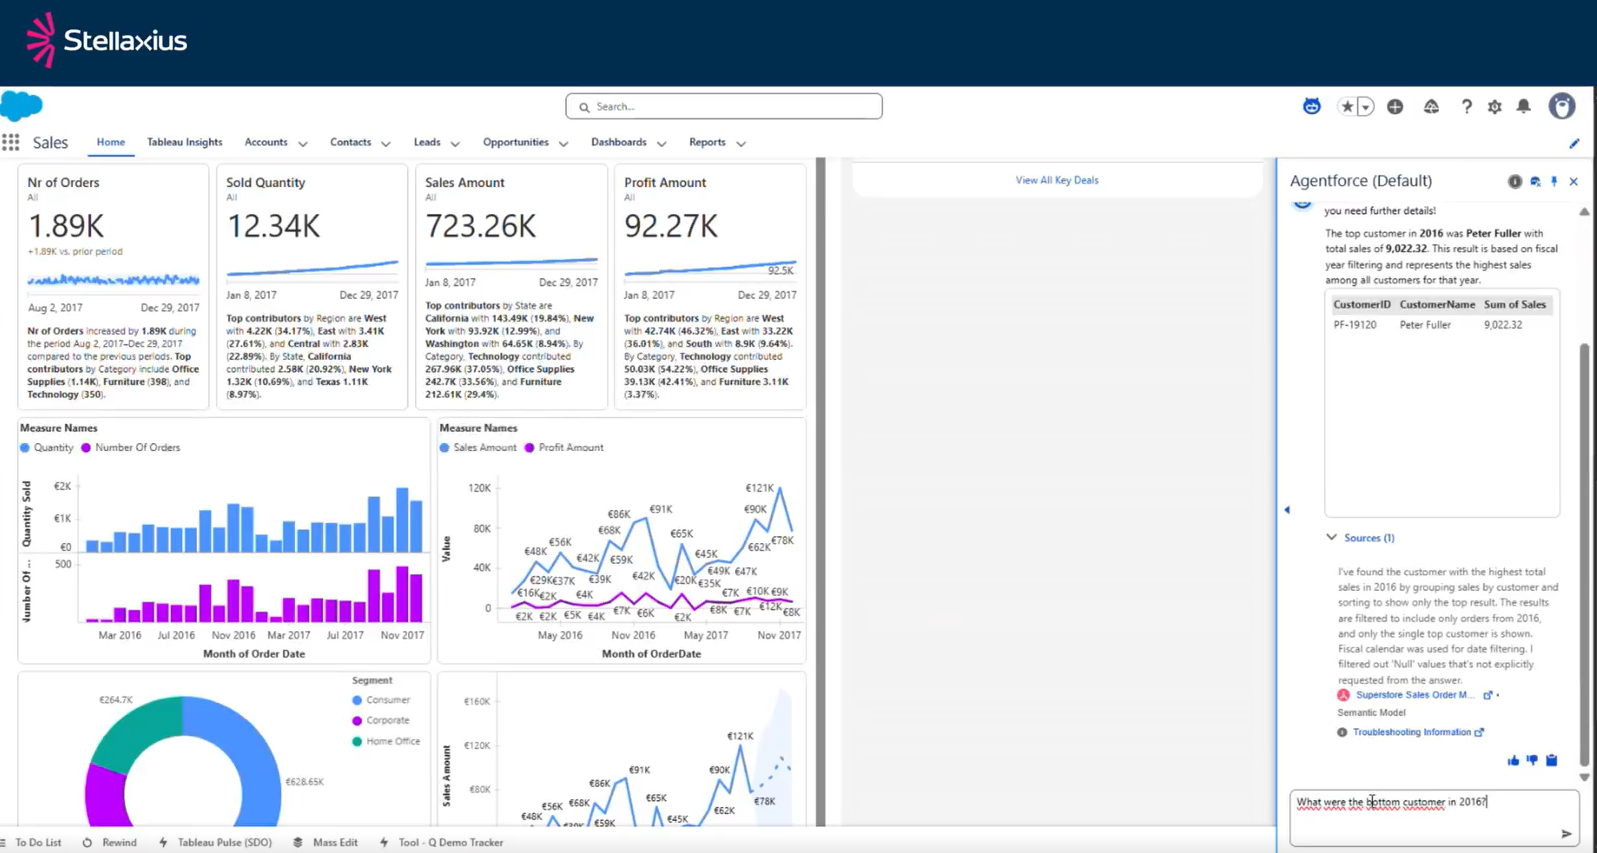
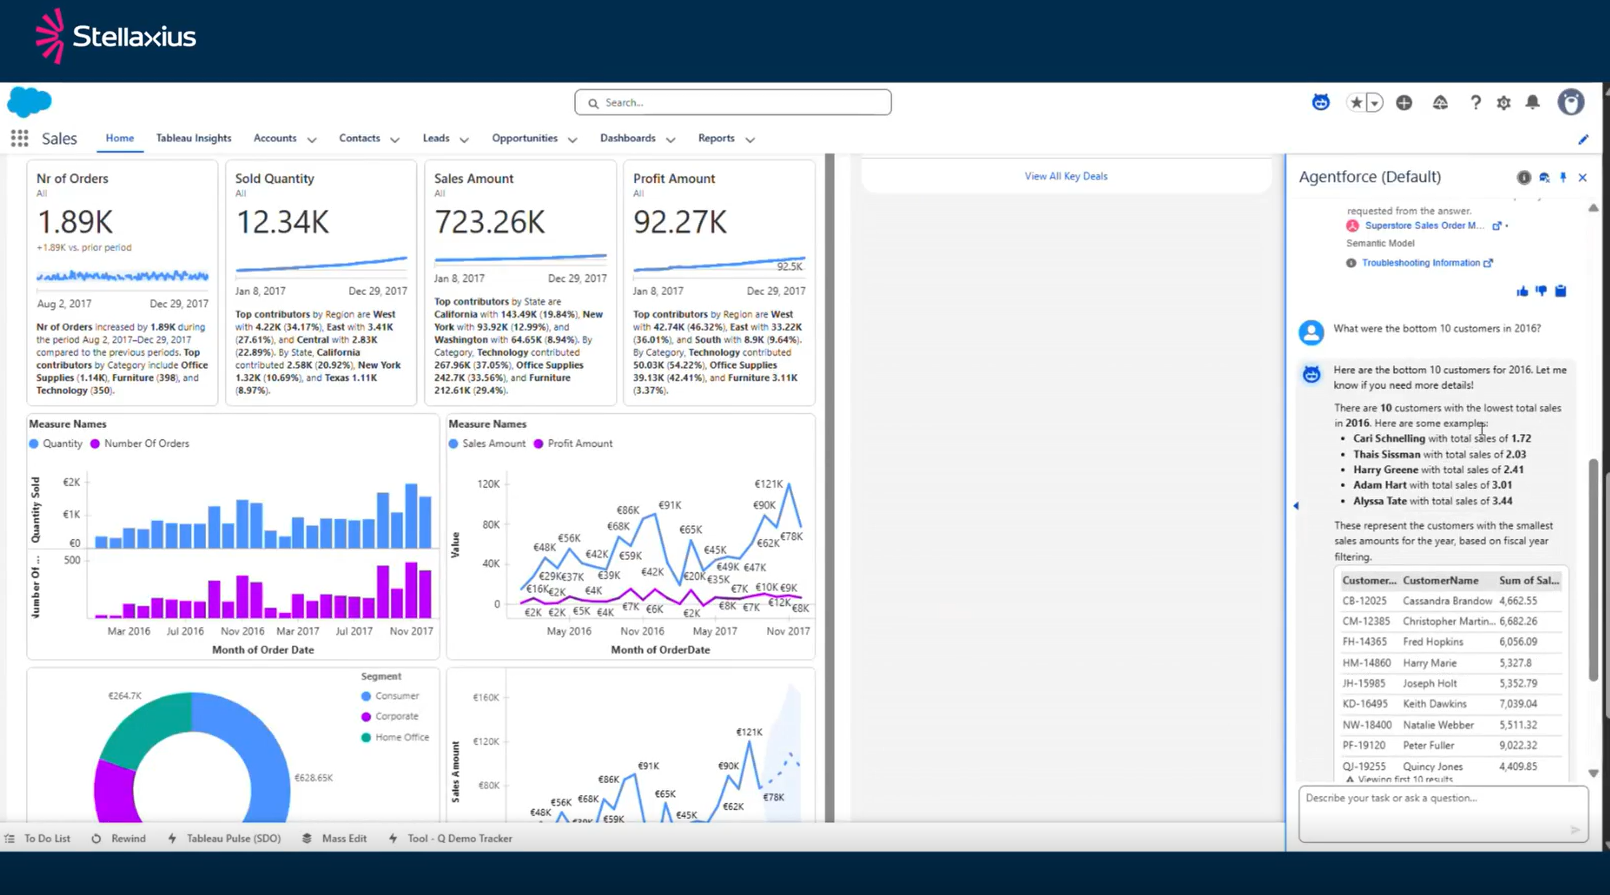
With this setup, you just ask. “Who was the top customer in 2016?” The agent tells you.
“What were the bottom 10 customers?” It shows you a list. The barrier between question and answer basically disappears.
6. Moving from Data to Decisions
The bigger picture here is about changing how decisions get made. Right now, there’s usually a lag. You need data, you look for it, you find it, you interpret it, and then you act. Each of those steps takes time, and time is where opportunities slip away.
At Stellaxius, we’re working to consolidate those steps.
Stellaxius Data Assets Valuation Strategy services help organisations transform fragmented data into strategic advantages. From governance frameworks to visualisation solutions, we build the foundation for conversational analytics.
Let’s talk about turning your data into decisions that matter.

I am an IT Consultant specializing in Data & Analytics, passionate about transforming data into actionable insights that drive business decisions. With a focus on leveraging modern analytics solutions, I aim to help organizations unlock the full potential of their data to achieve measurable results. Here, I share my knowledge, experiences, and the latest trends in the world of data, analytics, and technology. My goal is to empower professionals and organizations to make smarter decisions through data-driven strategies. Let's explore the power of data together!

I'm a Salesforce Consultant and Data & Analytics Specialist who bridges the gap between data complexity and business clarity. My technical expertise spans the full Salesforce analytics ecosystem—CRM Analytics, Tableau, and Data Cloud—while my broader skillset includes Python, R, JavaScript, HTML, MATLAB, SolidWorks, and Microsoft Office.
What drives me is the challenge of transforming raw data into strategic insights that actually move the needle!

I bring a strategic approach to data analytics as a consultant specialising in Tableau and Data Cloud solutions. My career has been defined by an appetite for challenge and continuous growth. I excel at bridging the gap between technical capability and business need, translating stakeholder requirements into data-driven decisions and robust analytics frameworks.