Table of Contents
Business intelligence (BI) is a term that dates back to the 1860s when a banker needed to gain actionable insights and advance over the competition. Since then, many companies have created software that converts raw information into filtered, understandable, and usable information. This is possible through the collection, integration, organization, analysis, and presentation of information with the primary goal of helping businesses in the strategic decision-making process, making it reliable and based on concrete information such as trends. Those are called Business intelligence Tools.
Keep reading to know the differences and similarities on Tableau vs Power BI.
01
of 03
Background on both Business Intelligence tools
Tableau was first launched in 2004 and was later acquired by Salesforce in 2019. By doing so, Salesforce strengthened its value proposition around Customer 360. Primarily aimed at business users, Tableau empowers them to unlock the potential of data.
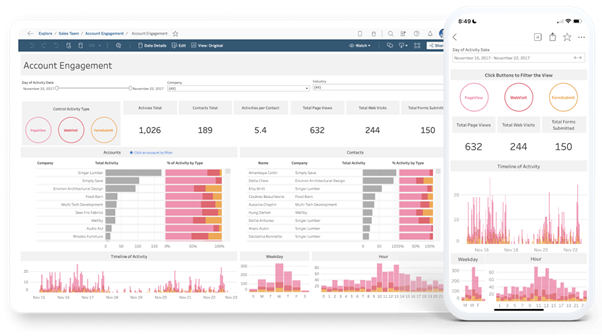
Tableau is a powerful visualisation tool that enables the creation of interactive dashboards that can be easily shared. By simplifying data exploration and management, this analytics solution fosters a data-driven culture and users can uncover insights faster, leading to impactful decisions that can transform businesses and boost results.
By combining different data sources, including databases, spreadsheets, cloud services, and others, it is possible to represent reality in visually appealing dashboards, and find patterns and relationships that might not be readily available in raw data. With its easy-to-use drag-and-drop functionality, the platform significantly eases the lives of its users, who no longer need a high level of technical expertise.
Check a full article on What is Tableau on Stellaxius Knowledge Center.

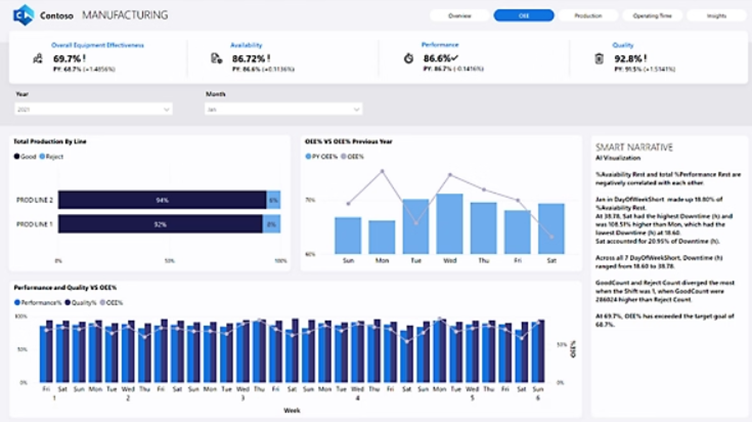
On the other hand, Microsoft Power BI was first launched in 2011 by Microsoft. The goal, just like Tableau, was to create an easy-to-use interface to enable non-programmers to organize and visualize data. It can collect multiple data sources, analyse and visualize data, as well as extract insights, and share it across various departments within the organization.
Being a Microsoft software, Power BI can be seamlessly integrated with other Microsoft tools like Excel or SharePoint. Through its powerful data modelling and analysis capabilities, Power BI helps organizations to have insights into business information as well as make data-driven decisions.

02
of 03
Similarities between Tableau vs Power BI
As you will have realized by now, there are a few similarities between Tableau vs Power BI, and this is why sometimes choosing between them may not be a straightforward decision.
That being said, what brings Tableau vs Power BI to be similar?
Connect multiple data sources
The first challenge for companies when entering into a data-driven strategy is the amount of information spread across a multitude of systems and channels. Thus, the first step that BI tools must enable is to connect and gather data from multiple sources. When comparing Tableau vs Power BI, both can do that through a wide range of off-the-shelf connectors.
Multiple possibilities for visualization
Both Tableau vs Power BI showcase data in a variety of different ways such as bar and line charts, treemaps, and geographical maps. Also on both platforms, you can easily interact with this information, with the drag and drop option to get more information as well as applying filters, and combine it to create interactive dashboards.
User-friendly
Both Tableau vs Power BI are great tools if you want to learn and are new to data analytics due to being its user-friendly interfaces which are super intuitive and understandable.
03
of 03
Main Differences between Tableau vs Power BI
On the other hand, Tableau vs Power BI have a few differences that must be considered when it is time to choose which one is more suitable for you or your company. The main differences are in the interface, data handling capabilities, and integration with other tools and platforms.
Target Users and Self-Service Capabilities
Due to being code-free, Tableau is aimed at business users who want to quickly explore data and build visualizations through self-service, as it doesn’t require deep technical expertise. With VizQL (Visual Query Language), Tableau makes it easy to transform data into interactive visuals simply through drag-and-drop. Power BI, on the other hand, is more suitable for data analysts, as it requires technical expertise and familiarity with data model logic and ability to use DAX (Data Analysis Expressions) to create complex formulas and perform analysis. This makes it Power BI more focused on a model where data experts create dashboards and share them with business users and less focused on self-service.
Platform Flexibility
Both Tableau vs Power BI have cloud based and on-premise solutions. However, unlike Tableau, Power BI on-premise one has far less functionalities than the cloud based option, it is very much limited to the Microsoft environment and highly dependent on Azure for data management. It is also important to know that the ability to perform live connections is limited on-premises, so if your use case relies on it, you should consider alternatives.
AI-powered Insights
Salesforce and Microsoft have strongly invested in AI feature development over Tableau vs Power BI. Both tools generate AI-powered insights, however there are differences on interactivity and the ability to share them. While Tableau applies advanced statistical models to explain data in interactive visuals, Power BI makes interactive charts available, but without AI specifics. Also, ‘Follow insights’ is available in Tableau Pulse for a user to subscribe and get automatic updates, while this feature is not yet supported in Power BI.
In terms of conversational features, Tableau pulse is based on keywords, recommeding follow up questions, and requires a metric to be selected. Power BI supports insights in dashboard context – single turn conversation – with no follow up questions recommended.
Tableau Differentiators
- Ease of use: drag-and-drop development functionality making it super easy for business users to configure, who don’t need to have technical expertise.
- Performance on large datasets: Tableau tends to perform better than Power BI with very large datasets.
- Availability everywhere: Tableau meets users where they are through email digests, slack chats or mobile updates.
- Security & Trust: Tableau is grounded on the Einstein Trust Layer, bringing a high level of differentiation in what concerns information security.
Power BI Differentiators
- Integration with Microsoft products: Power BI is developed by Microsoft and integrates well with other Microsoft products like Excel, SharePoint, SQL Server, and Azure, making it a no-brainer option for companied invested in Microsoft.
- Ease of use: user-friendly interface, ideal for beginners or those used to Microsoft products.
- Office 365: licensing costs may be attractive on Office 365 packages.
In short, the decision between Tableau vs Power BI for data visualization and insights hinges on your company’s unique business requirements. Evaluate their distinct features to determine the best fit for your use cases.
By choosing Tableau, especially with our Stellaxius team’s expertise, you’ll empower your business to make informed, data-driven decisions and foster a culture of innovation and agility. Our deep understanding of Tableau’s capabilities ensures that we can tailor the implementation to meet your unique business goals, helping you unlock the full potential of your data.
Ultimately, whether you’re looking to enhance your current data strategy or embark on a new one, our Tableau solutions provide the insights and expertise needed to transform your business. Let us help you turn data into actionable intelligence that drives actual results!


