Table of Contents
01
of 04
What is Tableau?
Born out of a Stanford computer science project in 2003, Tableau emerged from a vision to revolutionize data analysis. Its founders sought to break down barriers by making data exploration intuitive and visual, allowing people to understand information more easily. This focus on user-friendly data visualization became the cornerstone of Tableau’s mission.
It was later acquired by Salesforce in 2019, and by doing so, Salesforce made its value proposition around Customer 360 stronger than ever.
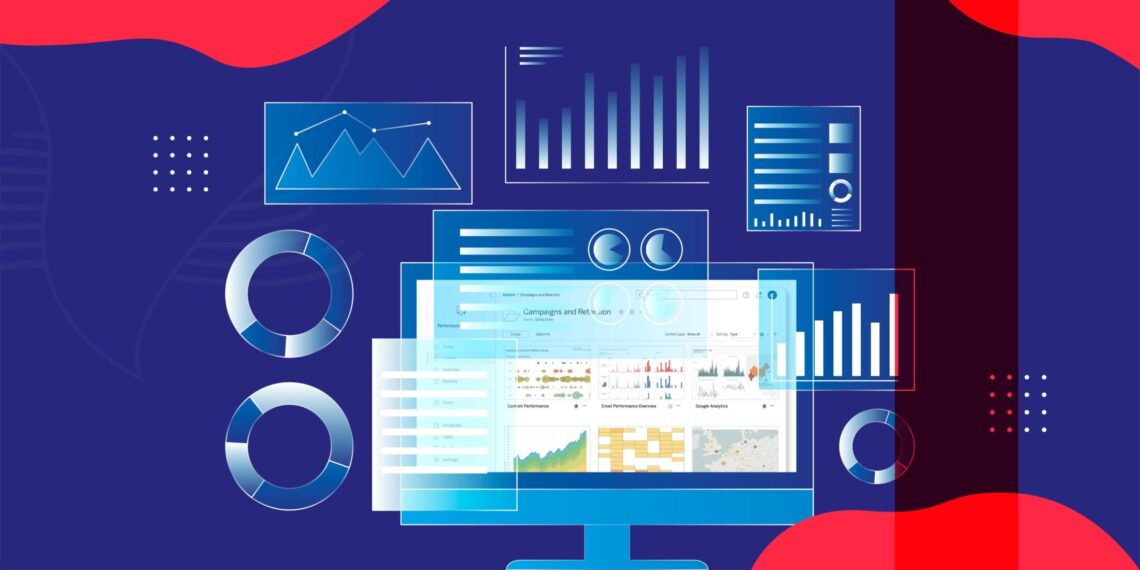
Primarily aimed at business users, Tableau empowers them to unlock the potential of data. This powerful visualization tool enables the creation of interactive dashboards that can be easily shared. By simplifying data exploration and management, this solution for analytics and AI fosters a data-driven culture. Users can uncover insights faster, leading to impactful decisions that can transform businesses and boost results.
By combining different data sources, including databases, spreadsheets, cloud services, and others, it is possible to represent reality and find patterns and relationships that might not be readily available in raw data in visually appealing dashboards. With its easy-to-use drag-and-drop functionality, the platform significantly eases the lives of its users, who no longer need a high level of technical expertise.
Overall, because of its features, it is widely used in businesses, academia and government organizations to analyze and visualize data, uncover insights and communicate findings effectively. Some of the key features of Tableau include:
- Data Connection: Connect to a wide range of data sources allowing users to import and analyze data from multiple sources simultaneously.
- Data Preparation: Transform data with its modern data preparation tool which simplifies the process of combining, shaping, and cleaning information.
- Visualization: Users can customize various visualization options, including bar charts, line graphs, scatter plots, maps, and more to suit their specific needs and preferences.
- Interactivity: Create interactive dashboards and reports, enabling viewers to explore data dynamically by filtering, sorting, drilling down and zooming in on specific areas.
- Sharing: Users can share their visualizations with others through Tableau Server or Tableau Online, allowing for collaborative data analysis and decision-making or setup dashboard subscriptions to keep stakeholders informed.
- Collaboration: Foster collaboration by enabling users with web edit capabilities to co-create or modify dashboards directly in a central location.
- Mobile Accessibility: Visualizations can be accessed and viewed on mobile devices, ensuring that users can analyze data and make informed decisions on the go.
02
of 04
How does it work in the Salesforce ecosystem?
Tableau has a seamless integration with the Salesforce ecosystem, enabling users to leverage the power of data visualization and analytics directly within Salesforce. Here’s how the platform works in the Salesforce ecosystem:
- Tableau Connector for Salesforce: it provides a native connector that allows users to easily connect Tableau Desktop or Tableau Server to Salesforce data sources. This connector enables users to extract data from Salesforce objects, such as leads, opportunities, accounts, and custom objects, and create visualizations using Tableau.
- Embedding Tableau Visualizations in Salesforce: Users can easily embbed Tableau visualizations in Salesforce Lightning pages, through a simple drag and drop. This enables linking analytics with their existing workflows.
- Salesforce Data Cloud for Tableau: Data Cloud is a great catalist as users can connect, harmonise and unify that from across multiple sources, including Salesforce, and providing the basis for data exploration and visualisation, leveraging business insights at scale.
- Visual Segmentation for Marketing Cloud: Using its visual capabilities, analysts can visually identify important customer groups to target. These segments can be uploaded to Data Cloud, where marketing teams can retrieve them. Marketers can then craft engagement strategies based on the segments and publish them directly to Salesforce Marketing Cloud, closing the loop back to the original campaign.
- Advanced Analytics and AI: Tableau Pulse provides a new approach to data exploration, making use of AI to automate data analysis and deliver personalized insights about your Marketing, Sales, Service data or other source. On laptops or mobile devices, Tableau Pulse delivers clear, plain-language explanations alongside the data, even anticipating potential user questions with its generative AI capabilities.

Overall, the integration between Tableau and the Salesforce ecosystem allows users to seamlessly analyze, visualize, and derive insights from Salesforce data, enabling organizations timely make data-driven effective decisions while boosting results.
03
of 04
Who is it relevant for?
Anyone who works with data and needs to analyze, visualize and distil insights effectively will benefit from Tableau. But Tableau can be particularly relevant for some roles, such as Business Analysts, Data Analysts and Scientists, Sales and Marketing Professionals, Operations and Supply Chain Managers, Finance Professionals and Executives and Decision-Makers.
Business analysts benefit from its robust visualization capabilities, using Tableau to uncover trends and communicate insights effectively. Data analysts and scientists leverage its features for in-depth data exploration, statistical analysis, and predictive modelling.
Sales and marketing professionals rely on it to track performance metrics, monitor marketing campaigns, analyze customer behavior, and optimize strategies. See the example of Lenovo India integration in this area, where they had a 95% efficiency improvement across 28 countries with the adoption of Tableau.
Operations and supply chain managers utilize it to streamline processes, monitor inventory levels, track production efficiency, and optimize supply chain operations. See Comair integration of Tableau on data across its operations, on everything from pricing and ticket purchasing to fuel consumption and flight punctuality.
Finance and accounting professionals find value in it for financial analysis, tracking, and forecasting. Know how Elsevier unleashed the power of data with Tableau.
Executives and decision-makers depend on its dashboards for a comprehensive view of business performance, gather actionable insights and to make informed decisions.
04
of 04
How can we help?
As a Salesforce implementation boutique, Stellaxius specialises in helping organizations realise the benefits of constant innovation with Salesforce technology.
Feeling overwhelmed by data? Want to leverage Tableau to gain actionable insights and transform your business? Stellaxius is here to help you. Our experts will:
- Align the platform with your business goals (no one-size-fits-all!)
- Collect, clean and harness your data (take complexity away)
- Craft a winning analytics strategy (metrics, visuals, the whole package)
- Deliver clear insights for all levels (digestible overviews to deep dives)
- Measure success (ensure you get value for money)
- Empower you with expertise (become data-driven)
Partner with Stellaxius and turn data into a powerful driver for your business success!


